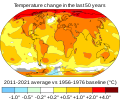
ගොනුව:Change in Average Temperature.svg

Size of this PNG preview of this SVG file: 705 × 599 පික්සල. අනෙකුත් විභේදනයන්: 282 × 240 පික්සල | 565 × 480 පික්සල | 904 × 768 පික්සල | 1,205 × 1,024 පික්සල | 2,409 × 2,048 පික්සල | 960 × 816 පික්සල.
මුල් ගොනුව (SVG ගොනුව, නාමමාත්රිකව 960 × 816 පික්සල්, ගොනු විශාලත්වය: 235 කි.බ.)
ගොනු ඉතිහාසය
එම අවස්ථාවෙහිදී ගොනුව පැවැති ආකාරය නැරඹීමට දිනය/වේලාව මත ක්ලික් කරන්න.
| දිනය/වේලාව | කුඩා-රූපය | මාන | පරිශීලක | පරිකථනය | |
|---|---|---|---|---|---|
| වත්මන් | 20:21, 8 මාර්තු 2024 |  | 960 × 816 (235 කි.බ.) | Pavouk | File uploaded using svgtranslate tool (https://svgtranslate.toolforge.org/). Added translation for cs. |
| 06:15, 6 මාර්තු 2024 |  | 960 × 816 (233 කි.බ.) | 이강철 (WMKR) | File uploaded using svgtranslate tool (https://svgtranslate.toolforge.org/). Added translation for ko. | |
| 21:15, 12 ජනවාරි 2024 |  | 960 × 816 (231 කි.බ.) | Efbrazil | Minor wording and graphic tweaks | |
| 20:45, 12 ජනවාරි 2024 |  | 960 × 816 (232 කි.බ.) | Efbrazil | Text tweak: in the last 50 years --> over the last 50 years | |
| 19:48, 12 ජනවාරි 2024 |  | 960 × 816 (232 කි.බ.) | Efbrazil | Updated to 2023 data, translations likely lost unfortunately, not sure how to keep those | |
| 12:40, 6 දෙසැම්බර් 2022 |  | 960 × 816 (287 කි.බ.) | Bjankuloski06 | File uploaded using svgtranslate tool (https://svgtranslate.toolforge.org/). Added translation for mk. | |
| 04:11, 6 සැප්තැම්බර් 2022 |  | 960 × 816 (285 කි.බ.) | Icosohedral | File uploaded using svgtranslate tool (https://svgtranslate.toolforge.org/). Added translation for zh. | |
| 04:02, 6 සැප්තැම්බර් 2022 |  | 960 × 816 (285 කි.බ.) | Icosohedral | File uploaded using svgtranslate tool (https://svgtranslate.toolforge.org/). Added translation for zh. | |
| 09:44, 25 මැයි 2022 |  | 960 × 816 (285 කි.බ.) | Jiaminglimjm | File uploaded using svgtranslate tool (https://svgtranslate.toolforge.org/). Added translation for id. | |
| 20:42, 13 අප්රේල් 2022 |  | 960 × 816 (285 කි.බ.) | Jiaminglimjm | File uploaded using svgtranslate tool (https://svgtranslate.toolforge.org/). Added translation for id. |
ගොනු භාවිතය
පහත දැක්වෙන පිටුව විසින් මෙම ගොනුව භාවිතා කෙරෙයි:
ගෝලීය ගොනු භාවිතය
පහත දැක්වෙන අනෙකුත් විකියන් මගින් මෙම ගොනුව භාවිතා කරයි:
- an.wikipedia.org හි භාවිතය
- ar.wikipedia.org හි භාවිතය
- az.wikipedia.org හි භාවිතය
- bn.wikipedia.org හි භාවිතය
- bs.wikipedia.org හි භාවිතය
- ca.wikipedia.org හි භාවිතය
- cs.wikipedia.org හි භාවිතය
- cv.wikipedia.org හි භාවිතය
- el.wikipedia.org හි භාවිතය
- en.wikipedia.org හි භාවිතය
- Causes of climate change
- Desertification
- Fred Singer
- Greenhouse effect
- Global warming potential
- List of climate change controversies
- Hydrocarbon
- Intergovernmental Panel on Climate Change
- Kyoto Protocol
- Montreal Protocol
- Naomi Klein
- United Nations Framework Convention on Climate Change
- Emissions trading
- Ozone depletion
- Climate variability and change
- Climate model
- Asian brown cloud
- Carbon tax
- Protected area
- General circulation model
- Instrumental temperature record
- Coal mining
- Patrick Michaels
- Václav Klaus
- Temperature record of the last 2,000 years
- Michael E. Mann
- Oregon Petition
- Clear Skies Act of 2003
- Nicolas Hulot
- Space sunshade
- James Hansen
- United Kingdom Climate Change Programme
- Petroleum industry
- Climate engineering
- World Climate Conference
- Climateprediction.net
- Description of the Medieval Warm Period and Little Ice Age in IPCC reports
- ECOPEACE Party
- William M. Gray
- Myron Ebell
මෙම ගොනුවේ තවත් ගෝලීය භාවිත බලන්න.


