ගොනුව:Stellar nebula simulation.jpg

මුල් ගොනුව (700 × 980 පික්සල, ගොනු විශාලත්වය: 69 කි.බ., MIME ශෛලිය: image/jpeg)
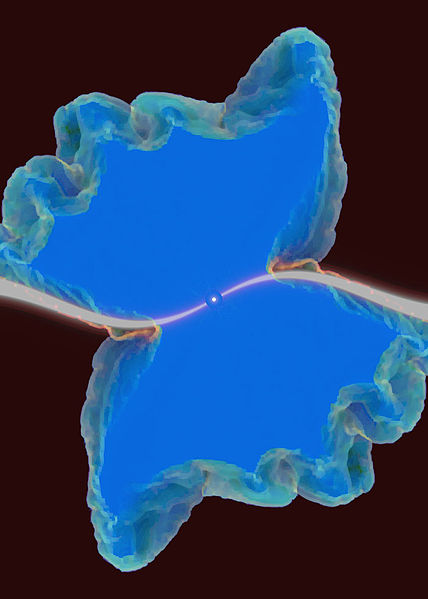
This image shows a snapshot from a hydrodynamics simulation movie by Vincent Icke at http://www.strw.leidenuniv.nl/~icke/html/VincentScience.html. Colour channels are coded as follows: red is the gas density, green the gas pressure, and blue is the absolute value of the velocity. This image is a logarithmic rendering of the actual flow, in order to improve the dynamic range. Superimposed on the plot is an image of the shape of the original disk, before the wind from the central object blew it up. Note the antisymmetric or `point-symmetric' structure of the resulting nebula: the shape is symmetric under inversion through the central star.
The GFDL license on Prof Icke's homepage releases this image under a GFDL license.
Image by Vincent Icke

|
Free Software Foundation විසින් ප්රකාශිත GNU Free Documentation License බලපත්රයෙහි 1.2 හෝ ඊට අලුත් පිටපත්වල කොන්දේසිවලට යටත්ව මෙම ගොනුව පිටපත් කෙරුමට, නැවත බෙදාහාරුමට සහ/හෝ වෙනස් කෙරුමට අවසර දී ඇත; ඒ වෙනස් අංශ නොමැතිව, මුල් පිටු පෙළ නොමැතිව, පසු පිටු පෙළ නොමැතිවය. බලපත්රයේ පිටපතක් GNU Free Documentation License නම් අංශයේ දැක්වේ. |
| මෙම ගොනුව ක්රියේටිව් කොමන්ස් Attribution-Share Alike 3.0 Unported වරපත යටතේ අවසර ලබා ඇත. | ||
| ||
| GFDL බලපත්ර යාවත්කාල කෙරුමහි කොටසක් ලෙස මෙම ගොනුවට බලපත්ර ටැගය එක් කෙරිනි. |
|
|
මෙම කාර්යය නිදහස් මෘදුකාංගයකි; Free Software Foundation මගින් ප්රකාශිත GNU General Public License හි 2 වන අනුවාදය හෝ ඉන් පසු ඕනෑම අනුවාදයක කොන්දේසි වලට යටත්ව එය නැවත බෙදාහැරුමට සහ/හෝ වෙනස් කෙරුමට ඔබට හැකිය. මෙම කාර්යය බෙදාහැර ඇත්තේ එය එය ප්රයෝජනවත් වේය යන බලාපොරොත්තුව ඇතිවය, නමුත් කිසිදු වගකීමකින් තොරවය; විකිණියහැකි බව හෝ කිසියම් කාර්යයතට ගැළපේ යන වගකීම පවා රහිතවය. වැඩි විස්තර සඳහා GNU General Public License හි 2 වන අනුවාදය සහ 3 වන අනුවාදය බලන්න. |
ගොනු ඉතිහාසය
එම අවස්ථාවෙහිදී ගොනුව පැවැති ආකාරය නැරඹීමට දිනය/වේලාව මත ක්ලික් කරන්න.
| දිනය/වේලාව | කුඩා-රූපය | මාන | පරිශීලක | පරිකථනය | |
|---|---|---|---|---|---|
| වත්මන් | 10:02, 17 ජූනි 2005 | | 700 × 980 (69 කි.බ.) | Rnt20 | This image shows a snapshot from a hydrodynamics simulation movie by Vincent Icke at http://www.strw.leidenuniv.nl/~icke/html/VincentScience.html. Colour channels are coded as follows: red is the gas density, green the gas pressure, and blue is the absolu |
ගොනු භාවිතය
පහත දැක්වෙන පිටුව විසින් මෙම ගොනුව භාවිතා කෙරෙයි:
ගෝලීය ගොනු භාවිතය
පහත දැක්වෙන අනෙකුත් විකියන් මගින් මෙම ගොනුව භාවිතා කරයි:
- ca.wikipedia.org හි භාවිතය
- da.wikipedia.org හි භාවිතය
- en.wikipedia.org හි භාවිතය
- fr.wikipedia.org හි භාවිතය
- hr.wikipedia.org හි භාවිතය
- it.wikipedia.org හි භාවිතය
- ko.wikipedia.org හි භාවිතය
- mk.wikipedia.org හි භාවිතය
- ro.wikipedia.org හි භාවිතය
- ru.wikipedia.org හි භාවිතය
- sh.wikipedia.org හි භාවිතය
- sl.wikipedia.org හි භාවිතය
- uk.wikipedia.org හි භාවිතය
- zh.wikipedia.org හි භාවිතය